Comparison tool
Analyse & contrast key performance
Our Brand and Digital radar maps illustrate the performance of each company. Benchmarked against 11 key categories get a clear view of who is outperforming who and why.
Contact.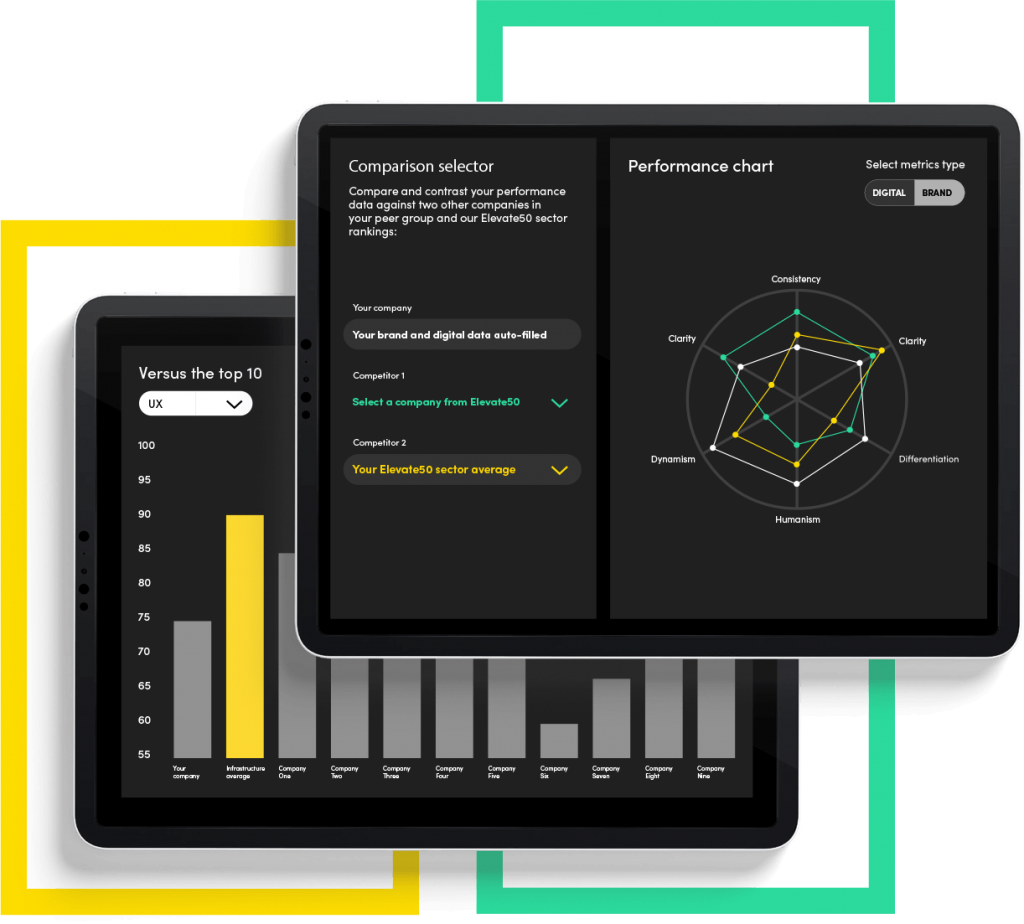
Elevate 50
Our team of strategic branding and digital analytics experts have ranked the most prevalent IT and Managed Service Provider companies in the sector. After analysing a diverse combination of 50 data points across both brand and digital performance we have compiled a unique data set showing both industry rank and a supporting data comparison dashboard:
| Rank | Company | Digital Performance Score |
|---|---|---|
| 1 | Air IT | 78.01 |
| 2 | Service Express | 76.60 |
| 3 | BCN Group | 75.40 |
| 4 | Cobweb | 70.29 |
| 5 | Ramsac | 69.20 |
| 6 | Stone Group | 63.93 |
| 7 | Acutec | 62.33 |
| 8 | Six Degrees | 61.93 |
| 9 | Little Fish | 61.88 |
| 10 | Content and Cloud | 61.75 |
| 11 | Zenzero | 58.60 |
| 12 | The Access Group | 57.66 |
| 13 | Sys Group | 56.03 |
| 14 | Risual | 55.61 |
| 15 | Total Computers | 53.97 |
| 16 | CIT (Complete I.T Ltd) | 53.36 |
| 17 | Xperience | 52.76 |
| 18 | Acora | 52.25 |
| 19 | Microbyte | 51.99 |
| 20 | M-Tech Systems Ltd | 51.38 |
| 21 | Transputec | 51.23 |
| 22 | Tieva | 50.97 |
| 23 | BSO | 50.46 |
| 24 | Digital Space | 50.46 |
| 25 | Netitude | 50.30 |
| 26 | Razorblue | 49.85 |
| 27 | Wavex Technology | 49.18 |
| 28 | Bridgeall | 47.76 |
| 29 | Pure IP | 47.31 |
| 30 | Chorus | 46.92 |
| 31 | Atlantic | 46.43 |
| 32 | Centreprise | 46.19 |
| 33 | Lucidica | 46.15 |
| 34 | Wanstor | 45.99 |
| 35 | Breakwater IT | 45.52 |
| 36 | Sword | 44.43 |
| 37 | Highlander | 44.37 |
| 38 | Natilik | 44.36 |
| 39 | Kick | 42.37 |
| 40 | Nexus | 41.47 |
| 41 | CWL | 41.08 |
| 42 | Zsah Limited | 40.38 |
| 43 | Cisilion | 40.04 |
| 44 | Transparity | 39.87 |
| 45 | IT Champion | 38.39 |
| 46 | Piran Technologies | 37.41 |
| 47 | Lima | 35.62 |
| 48 | Ziptech Services Ltd | 33.50 |
| 49 | Nviron | 33.37 |
| 50 | Netmetix | 21.64 |
Could not find a company?
of companies are not investing sufficiently in ESG.
of companies don’t stand out among their competitors.
of company websites offer their customers a good user experience.
Comparison tool
Our Brand and Digital radar maps illustrate the performance of each company. Benchmarked against 11 key categories get a clear view of who is outperforming who and why.
Contact.